My first time reverse engineering binary files! (StatView!)
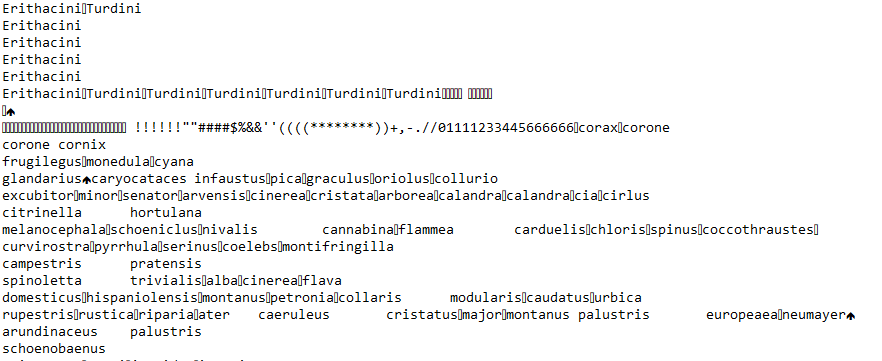
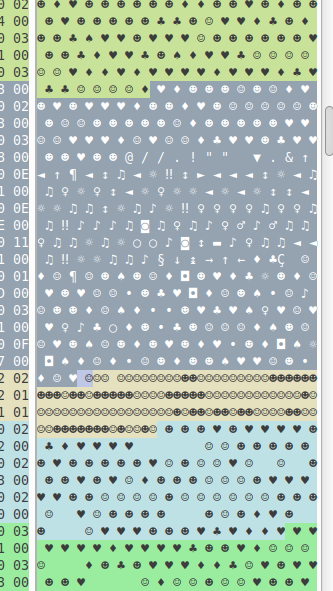
A year or so back an email went out to the department, with the title ‘Help needed: Subfossil data + StatView’. Apparently the sender of the email (Tamara Emmenegger, my enthusiastic collaborator, without whom this analysis obviously never would have happened!) had come across some data locked in a file format that was apparently popular in 80’s. I know nothing about subfossil data or StatView, but what caught my eye about the email was the attached image:
Now, I recognize a binary file when I see one, and I had been interested in familiarizing myself with hex editors and binary file formats for a while. Liberating data older than I am was the perfect excuse! In this post I’ll try to outline how I went about sorting this out, basically going from never having used a hex editor, all the way to setting up an R script to extract data that hadn’t been touched since 1989 or so.
Finding a good hex editor1
This being the first time I did anything like this, my first task ended up being identifying a hex editor suitable to the task. I played around with xxd since I’m used to CLI interfaces, but initially I focused mainly on the rightmost column of ASCII translations, which was not very informative. This was not the right tool for me.
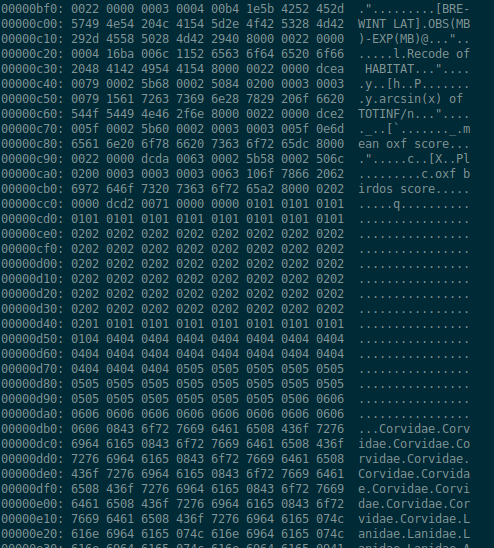
Next in line was the GUI GHex: immediately more informative! Now I’m able to see not only hex and ASCII representations, but floats and ints of various sizes! Some googling informed me that little endian and big endian refer to the byte order, i.e. in which order bytes are read to form e.g. a float.2
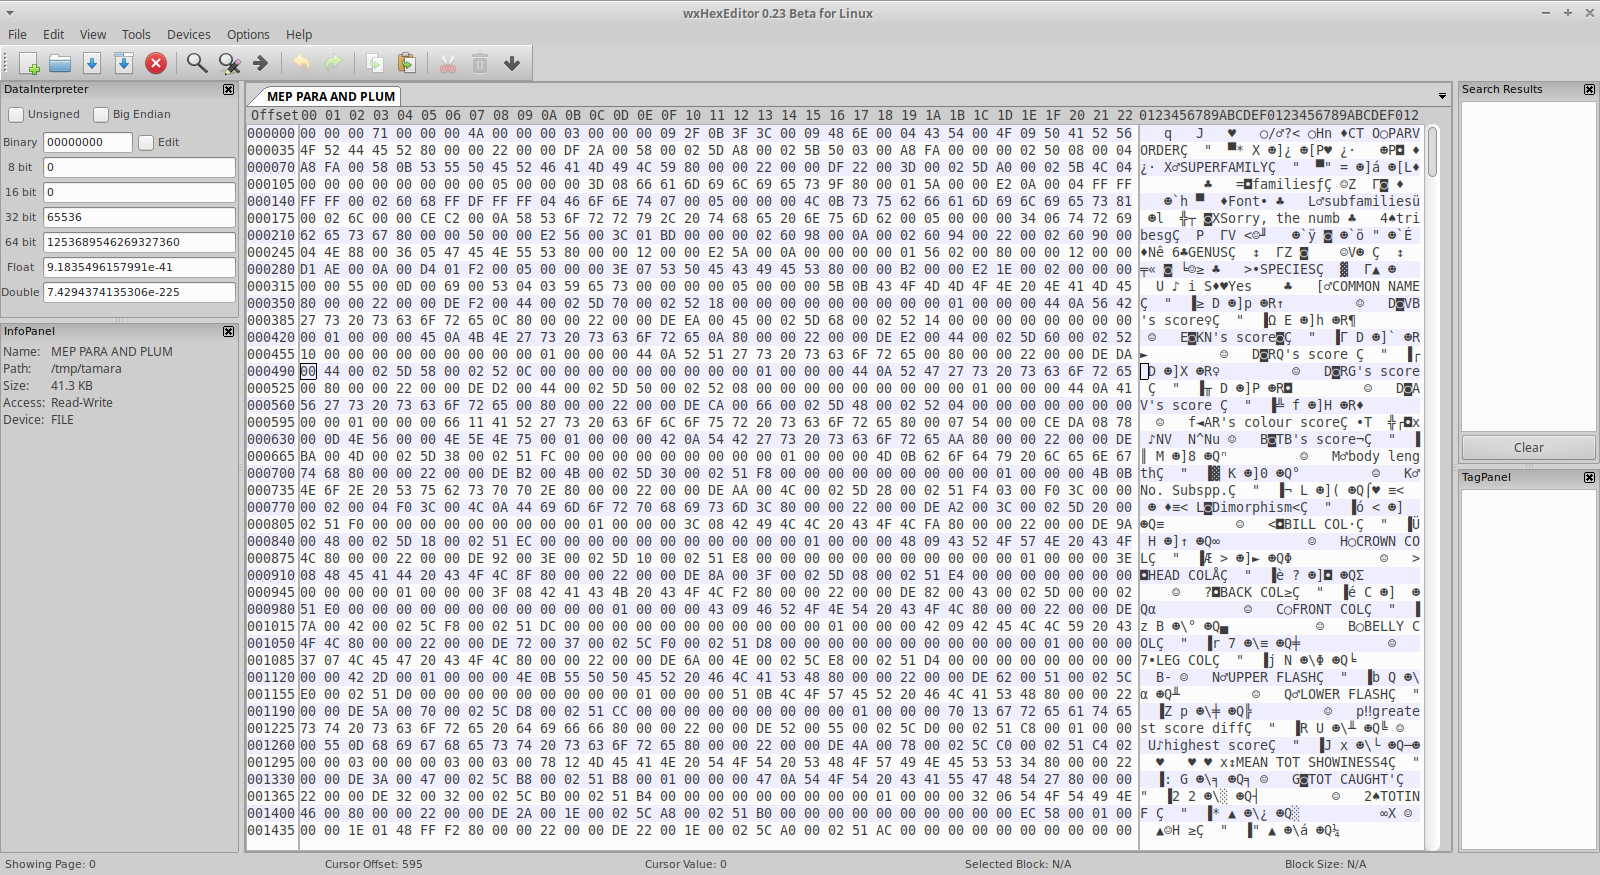
Anyway! It still felt like I was left wanting - scrolling through the file with GHex didn’t get me far. Next I stumbled across wxHexEditor, and the first striking difference to the other two hex editors was the representation of non-ASCII-coding bytes. In both GHex and xxd, all non-ASCII bytes are represented by a .. In wxHexEditor, these are represented by non-ASCII characters, meaning that the NULL byte 00 is represented as a blank, 01 and 02 get represented as different emojis, etc. The very clear upside to this is that scrolling through the file and only looking at the text panel provides a very nice overview of patterns in the data. Another neat feature of wxHexEditor is tags, i.e. the ability to add annotations to different parts of my binary file. It allows us to color code and make notes from different parts of the file - very useful!
Figuring out StatView file structure, more or less…
Now, in parallel with this there was obviously some exploration going on. All three editors had made it apparent that there was some ASCII text present in the beginning of the file, stuff like “PARVORDER”, “SUPERFAMILY”, “GENUS”, “AR’s colour score”, etc. Each of these has a number of characters following them, often with a x80 close by the end of the ASCII string. Initially, I spent a lot of time trying to understand the space in-between these strings, assuming that some data of interest was stored there, but scrolling further down the file with this editor, it became apparent that what I was looking at was probably column headers, with their corresponding data stored further down in the file! Talking to Tamara I got the shape of the data confirmed - up until this point I had not been sure that it was tabular data I was expecting.
Where to from here? Some of these columns, e.g. “COMMON NAME”, contain ASCII data, and contain data that’s understandable (at least to someone who’s more familiar with birds than I am!). A joint effort by Tamara and I helped us distinguish each row here - essentially by copying the text from the hex editor into a regular text editor and cleaning it up. This in turn gave us the number of rows in the file, as well as the first actual data out of this file!
So, at this stage, we have column names, and their probable order, along with the number of rows present, as well as the content of some of the plain-text columns. Very nice! Since Tamara’s familiar with the data, she could tell me e.g. that we expect all score columns to contain values in the range 1-6, which columns we expect to be integers and which we expect to be floats. Now, looking closer at the text field of the file, we can see ranges of similar-looking characters. Using the expected ranges for the values, along with the number of rows in the file, we are able to split these up into very nice chunks, and parse out single byte values for categorical variables, two-byte values for the integer scores, and what seems to be 10 byte floats. Wait a minute, 10 byte floats?!
What on earth are 10 byte floats, and how do I read them?
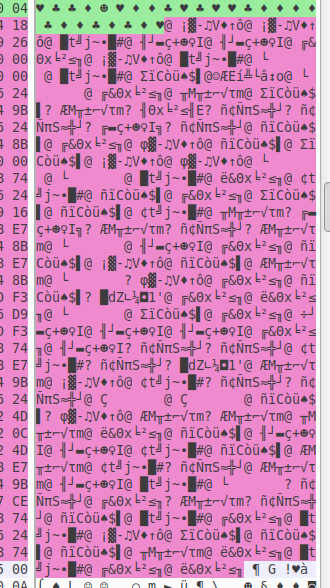
Wait, what? Floats are supposed to be 4 or 8 bytes long! What is this nonsense?! Well, looking at the data, we have a very clear region, the number of bytes ten times as many as the expected number of rows, and with a very clear pattern starting with @ every 10 bytes. Counting the number of columns we see that this corresponds to the column ‘Mean tot showiness’, and for a mean I guess a float makes sense. Well, googling a bit, it turns out that there’s something called ‘extended precision’, and that some specs of this include 80 bit floats. Now, how do we handle these?
Up until this point, R has supported reading this binary file out of the box - provided I give the right offset to the first numerical column, I’m able to read one column at a time as long as I provide which type and size each column has, using Rs readBin function. R does not support reading float80 out of the box… Does any modern computer?
Here I went spelunking into various extended precision formats. C has support for long double, i.e. float128, and doing a deep-dive into the specs of float80, it turns out that float128 is just float80 with additional bytes tacked on at the end! So, what do we do? Here I turned to Rcpp and brushed of C++ skills I hadn’t used properly since 2008. Using Rcpp I:
- read the relevant bytes as
chars (1 byte each) - iterate through the array to add zero-bytes to the end of each float, flipping the byte order while I’m at it in order to account for endianness
- cast the new array as an array of
long doubles (16 bytes each) - turn this into an Rcpp
NumericVector
The code to run this is all available at https://github.com/nikostr/reversing_statview. I’m not a regular user of C++ or Rcpp, but it does the work, and is maybe possible to adapt if you run into 80 bit floats at some point?
Success!
Anyway! Once I had a way of reading the data portions of the file, outputting something that looked right was pretty straight forward! Tamara - who actually understands what the data is supposed to mean - had a look, and Andrew Read who was involved in the original publication of the data (doi:10.1038/339618a0) also had a look. Tamara and I spent some time going over the column headings from the StatView files, and Tamara cross-referenced these with the data available in the publications to identify what each column actually corresponds to, cleaning it all up nicely, and confirming that the data made sense and that column headings seemed to match the ranges of the data we actually extracted.
And now we’re here! After some delays (I’ve published a thesis in the meantime) we’re now at a stage when we think we’re ready to share this data - more than 30 years after initial publication it’s now publically available and accessible in a format that’s readable by anyone. The cleaned datasets are available at doi:10.5281/zenodo.8117246 and doi:10.5281/zenodo.8116290, and the original data files and the code to read them into R tibbles is available at https://github.com/nikostr/reversing_statview.
More on the StatView format
If anyone else runs into old StatView files they want to liberate, I’ll just leave a few notes here (also available in the GitHub repo) regarding the StatView file format:
- The 4th byte of the file provides the number of rows of data
- The 8th byte of the file provides the number of columns
- The overall file structure consists in a header definition providing column names (and probably column types, but I haven’t figured out how these are encoded) followed by each column of data.
- Strings are preceded by the number of bytes the string contains.
If all of this just feels super confusing and out of your depth, former StatView product manager Erin Vang also seems to be doing pro-bono work in converting StatView files into other formats: more info regarding that is available here.
Thoughts?
I’m super new to this - this was the first time I ever used a hex editor. If you have thoughts or comments regarding this, feel free to reach out to me through Mastodon (nikostr@scholar.social) or to Tamara through Twitter (@tavimalara).
-
In figuring out how to work effectively with these, it turns out that there were a ton of tutorials, mainly from gamers on YouTube, that dig into how to use these. This was a valuable resource to me when getting started. ↩
-
A messy aside on some binary stuff: a byte consists of 8 bits, i.e. 1s or 0s. In binary, one byte can represent the numbers 0-255=2^8 - 1, in the same way that 8 decimal digits could represent any number in the range 0-99,999,999=10^8-1. The way I’ve understood this, bytes are read the way they are - they correspond to their values, and we don’t need to worry about bit order. However! On the byte level we need to think about this. If we want to write the number 259, we need two bytes, with one having the value 1 (corresponding to 2^8=256) and one having the value 3 (corresponding the 2^0+2^1=3 we add to 256 to make 259). Do we write this as 3 followed by a 1, or the other way around? Little endian means storing the least significant bytes at the smallest address, i.e., first(?), and in this case that would mean having the bytes in the order 3 followed by the 1, with the opposite being the case if we’re storing them in a big-endian way. If we mix these up we get in trouble - reading
03 01as a big-endian number gives up 2^9+2^8+2^0=769 instead of the 2^8+2^1+2^0 we were really out to represent. This is basically like establishing a convention for whether we read regular decimals number from left to right or the other way around, i.e. in the number 1337, does the 1 correspond to 1 * 10^3, or 1 * 10^0? Some good tools for those of you interested in learning more are https://float.exposed, https://integer.exposed/, and Julia Evans’ zine on integers and floats: https://wizardzines.com/zines/integers-floats/ - haven’t read this last one myself, but Julia’s stuff is usually great! ↩